| Technical Skill |
Can turn on Labquest unit & connect a sensor. Uses stylus to navigate between different views. Can often start data collection without assistance. |
Understands only one menu function. Has trouble locating major functions and activating them. Makes some mistakes inputting run parameters. Can start data collection without assistance. |
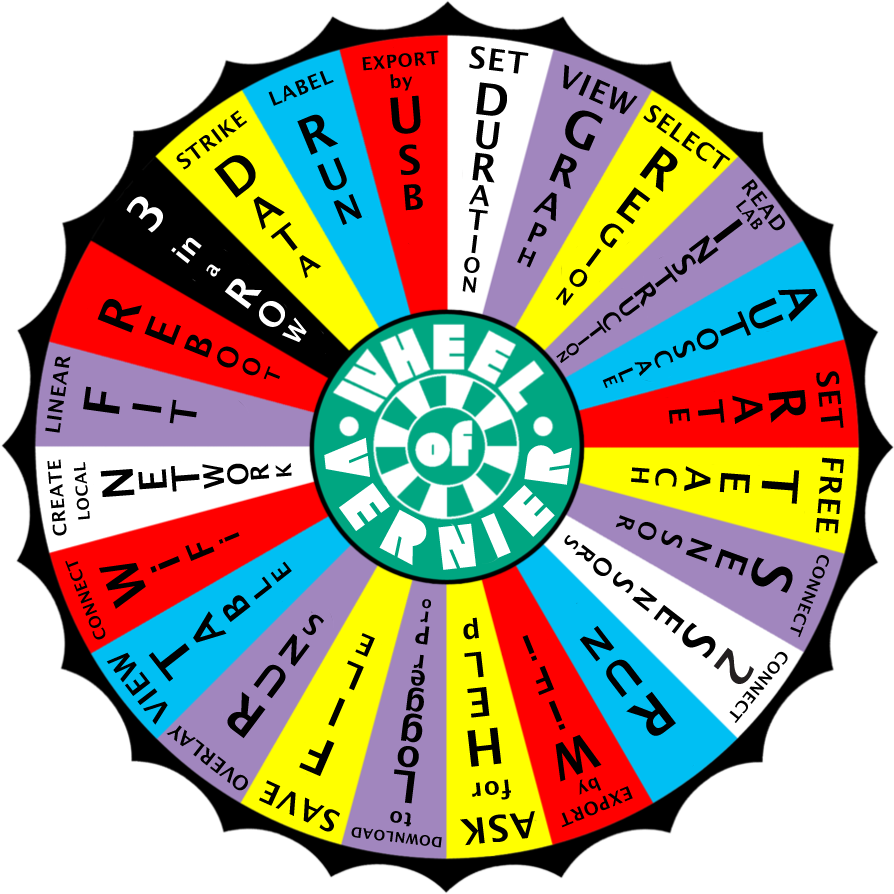
Understands the major menu functions and locations; can locate & use most submenus. Able to setup and change run parameters. Reliably starts data collection. Uses labels well. Can save & recall files. Only uses one method for exporting data files. |
Understands all menu and submenu locations &functions without searching. Easily able to setup & change run parameters. Confidently starts & manipulates data collection. Always uses descriptive labels. Can save & recall files. Easily able to export data files using several different methods (email, USB drive, LoggerPro software, Vernier app) |
| Data Analysis |
Collects data, but cannot interpret significance of graph or data table views. Makes mistakes interpreting x & y axis. Collects needless amounts of run data. |
Can often apply a linear fit to a graph. Can make predictions, but with faulty interpretations of graph data. Able to show data trends with some assistance. |
Understands when to use most Analyze menu functions. Can usually make some good predictions. Correctly interprets the major outcome of experimental run(s). Toggles between graph & table views. |
Understands when & why to use Analyze menu functions for evaluating runs. Always able to accurately predict trends in data and show comparisons by overlaying runs. Always uses stylus/graph functions to manipulate & interpret data. Easily toggles between graph & table views. |